Wednesday, 9 November 2011

the TUTORIAL & 500 WORDS


Stephen Dovas- How To Read Multiple XML Documents and make an entity move/rotate. (500 WORDS)

Gathering data in XML format can lead to the analysis of essentially anything. This I think will be a major step for determining outcomes of certain choices or decisions made either by a person or a company.

I have chosen to make a tutorial, on how to “Read through multiple XML documents and get the value from each document to trigger an entity to either move or rotate”. I found this was somewhat fiddly to understand, however once I had succeeded in making the flowgraph work correctly, it enabled me to do just as I wanted. My tutorial is aimed at those who have an assumed knowledge of crisis or sandbox editor and the flowgraph system however are still at a basic or beginner level. Through my tutorial I will show users how to read the xml documents, and also explain each node that will be entered into my Flowgraph.

This tutorial in which I created, I believe will be beneficial as it can be used for a variety of purposes. In regards to reading XML’S the flowgraph could be implemented into many ideas, or concepts regarding the gathering of data. For my chosen concept however, I explain throughout the tutorial that the flowgraph allows the XML document to be opened and finds the value of a certain ‘child’. If the value is above an assigned numeral value within another node in the flowgraph, the result will be that the selected entity will either move or rotate to a desired and assigned position within the environment. If the data drops and the values are below the assigned number the entities return or yet again move to another position (in the case of my tutorial – they return to the original position).

The installation of the flowgraph plugin system is a pre requisite to doing this tutorial – I have assumed that people already have completed this and installed the plug in. As the tutorial progresses, I explain each node and its function. This all begins with the ‘input key’ which triggers the entire flowgraph. The next is the ‘MATH: Counter’ node which counts through the desired number of XML documents you assign. Following that comes the ‘String: Combine’. This node’s function is to combine the allocated XML’S of the same name, in order for them to be counted and read. The following 4 Nodes are various types of XML nodes beginning with ‘XML: Open Document’ sorting through ‘XML: Get Root’, ‘XML: Get child’ and ending with ‘XML: Get Value’ these open the document, find the root sort through the named children and get the desired value. The node ‘Math: Less’ determines whether the value is above a certain threshold if so – it triggers the move/rotate entities.


In studying previous students tutorials, and examining others, I have tried to implement certain qualities throughout the tutorial that I myself found to be helpful. An introduction I think is necessary as it allows the viewer to understand who you are and how you have knowledge of the subject. Also briefly stating what programs are to be used is beneficial. Most importantly a short demonstration allows the viewer to have an understanding of what the outcome of the tutorial will be. Some tutorials i noticed used these and were my inspiration to follow were Vinh Nguyen's Tutorials, Russell Lowe's Tutorials, And Rosemarie Still's Tutorial.

 the ANALYTICS ENGINE FILM


Life today seems to constantly become busier as we are engaged with more duties throughout our day. Traffic is a major problem in most metropolitan areas as a greater amount of people travel to the city, this causes more delays, more people to speed, more accidents and in the worst cases casualties. This problem is seen all throughout the world today. 

From the selected pachube feed, data is retrieved recording the number of people, entering into a room, my mutation of this idea or concept was to translate the same feed towards my concept of the BRIDGE. 

The feed continues to measure the number of people however on a bridge. The data allows a viewer to draw conclusions that would be difficult (or impossible) to reach by interrogating the data in its raw form. This is done by objects or certain things happening as a result of the data's values. 


1 - The middle platform of the bridge lowers
2 - A boom-gate rises to allow the flow of traffic over the third created bridge


THE FINAL FLOWGRAPH TO ALLOW THIS ALL TO HAPPEN 


SKETCHUP MODEL 


The correct mod for this assignment is called 'z3377562_Exp2' - To access this quicker you may download that folder straight from the link below:


The Analytics Engine - Week 5 | REVIEW OF STUDENTS TUTORIAL


Below are the marking Schedules I completed whilst watching two previous students tutorials. The two students were Rosmarie Still with her – Installing the Flowgraph Plug in System, and also Ivan Hrusrescky’s and his tutorial on Advanced Camera Movement.


The Analytics Engine - Week 4 | INITIAL PARAGRAPH OF TUTORIAL


I have chosen to make a tutorial, on how to “Read through multiple XML documents and get the value from each document to trigger an entity to either move or rotate”. I found this was somewhat fiddly to understand, however once I had succeeded in making the flowgraph work correctly, it enabled me to do just as I wanted. My tutorial is aimed at those who have an assumed knowledge of crisis or sandbox editor and the flowgraph system however are still at a basic or beginner level.

THIRD FLOWGRAPH ANALYSIS


The Analytics Engine - Week 4 |  XML DATA MOVE


The above video and flowgraph show the Xml document being opened and the flowgraph searches through till it finds a value. the value cause's the middle platform of the bridge to lower down to ground once it is 5 or above the number coming up is constantly 8 as its opening one document. (this was a test for the final product)

Wednesday, 2 November 2011

The Analytics Engine Week 3 | The BRIEF

For my proposed idea for Exp2 - The Analytics Engine, I decided to further expand on my chosen pachube feed which looks at Creating space with light as a result of the number of people entering and leaving a room. I will develop my ideas through the use of the Crysis wars environment. Also the use of flowgraps and entities such as people cars, lights, and objects, I hope to achieve my end result of aiding the viewer to have a greater or clearer understanding of the data that will be involved throughout the installation.

Life today seems to constantly become busier as we are engaged with more duties throughout our day. Traffic is a major problem in most metropolitan areas as a greater amount of people travel to the city from the suburbs for various reasons. My Crysis environment will depict a simple suburban environment, which is bridged apart from the central city. The bridge is the key in this installation into the environment as it allows people, to travel to their destination.

Through the data retrieved, i will be looking at creating Less traffic over the bridge. When a certain amount of cars are on the bridge (according to the data from the xml) A separate third platform will drop down and in effect create another bridge to be used. This will Clear the way for travellers and allow people to get to their destination on time

Thursday, 6 October 2011

The Analytics Engine - Week 3 | INFOGRAPHICS

1 - Stuxnext | Anatomy of a Computer Virus

The video below documents how a computer coded virus "stuxnet" can be used as a weapon and is available to anyone at any time.


2. MAC person vs PC person

The Image below stereotypes people into two categories, either your a MAC person or your PC person. The data was collected in a variety of different categories, and through this you are able to discern which type you are (however this study was taken on a general public group). I find it not only interesting as a collection of data, but also as i am a mac person. 

2 .VISUALIZING THE U.S. DEBT


The U.S. Debt Visualized is a great visualization of scale, where you start with a single $100 bill, and start stacking them in orders of magnitude. Stack them on pallets, start stacking the pallets and show them in comparison to other real-world items. 


114.5 TRILLION DOLLARS

$ 114, 500, 000, 000, 000. - US unfunded liabilities to the right you can see the pillar of cold hard $100 bills that dwarf the former World Trade Centre & Empire state building - both at one point were the words tallest buildings. If you look carefully you can see the stature of Liberty


SECOND FLOWGRAPH ANALYSIS
The Analytics Engine - Week 2 |The FLOWGRAPH


The flowgraph in which we were instructed to implement into our scheme or our own individual flowgraph system, was designed to recorded the distance of the local player in relation to a selected or assigned entity. In my case I chose to assign a boat in my environment. As the local player or avatar approaches the boat or begins to draw near to the entity, the data or numbers displayed onto the screen through the "showHUDmessage" decrease upon approach. 


The flowgraph in its entirety 


The left section 


The right section 

In the video below the result of the above flowgraph is seen as the avatar moves throughout the environment making his way to the boat. The numbers can be seen on the bottom half of the screen.


The Analytics Engine - Week 02 |INDEPENDENT STUDY Research


The above technique could be incorporated, into my environment and flow graph system. At the moment the entity that has been assigned is the speed boat. Data is being collected in the form of distance and movement to and from the boat. This could be moulded to collect data between the avatar and a specified entity resulting in the luminance of light over a certain area. The choice of natural light could be used in applying different parts of the day to various parts of the environment - as in the further away, would result in the later in the afternoon/night it becomes. However artificial light would seem and prove to be easier and more flexible with the flowgraph plugin system.


http://www.moddb.com/groups/cryengine-2-developers/tutorials/cryengine-flowgraph-tutorial - I learnt many basic methods from this site about flowgraph's and how to navigate around and control them 


http://incrysis.com/forums/ - This site has a variety of different forums which deal with a number of different problems and tutorials to do with flowgraph's.


http://www.youtube.com/watch?v=n-p9ImdQp0I - This tutorial helped as i had no idea on how to create a road correctly.


Tuesday, 4 October 2011

FIRST FLOWGRAPH ANALYSIS
The Analytics Engine Week 01  | ANALYSIS OF MOVING ENTITY

The image below shows the flowgraph which I created with the help of Russell. The flowgraph measures the velocity, in m/s (meters per second) of the assigned vehicle as it is driven, and outputs the numerals and recordings onto the screen to be seen, as it is driven. As the vehicle travels faster and above 10mph, it activates the movement of a secondary entity, the gate, to open and allow the exodus into the outer terrain. However if the vehicle does not travel faster than 10mph the gate will not be opened. This was controlled through the use of the ‘math:less’ input’s implemented into the flowgraph as seen below. 


Flowgraph to measure velocity. 


The Analytics Engine - Week 01 - INDEPENDENT STUDY


Chosen Pachube Feed - CREATING SPACE WITH LIGHT

"The sense of space is created using light. The number of people entering and leaving a room directly correlates to the floor area which is lit up. As more people enter the room the lit floor area increases. As more of the floor area is lights up the concept or a larger space is created."

STRENGTH
WEAKNESS
Light can be seen all around us at any time and any place, whether it is natural or artificial. The strength of this feed is that, it measures the area of a room through the number of people and displays the gathered information through the sense of light.  
A weakness of this feed is that the light as subjects move in transition in and out of the room being monitored, the light may not represent the true data. Also another primary weakness is that the feed is frozen and has not been updated.
OPPORTUNITIES
THREATS
This feed has may opportunities as through the Crysis environment, this feed can be incorporated into many different installations. One would be to directly relate the information of the feed - a possibility would be having multiple avatars enter and leave a room showing the luminance of the room change 
The flowgraphs needed in order to represent my chosen feed could prove to be difficult to achieve - however a task that will be overcome. Also the time of day could hinder aspects of representing the feed in its true form.


EXPERIMENT 2 - THE ANALYTICS ENGINE 


Friday, 9 September 2011

CRYSIS MODS FOLDER 


The following link will take you to game front. This is where I have uploaded my entire Mods Folder for download.


http://www.gamefront.com/files/20765481/Mods.rar
MACHINIMA DOCUMENTARY


In the Video above my Machinima documentary can be seen for . This is a video of my installation in the Crysis War Level, Quarry, showing my representation of the information obtained through my chosen Pachube Sensor. The sensor has to do with light, by using the flowgraph system through Crysis I used different lights to show the way that light will directs movement throughout a certain space. It explores my relation between the Pachube  Sensor and Paul Virilio’s concept of ‘Pure War.

Wednesday, 7 September 2011

SKETCHUP MODEL + PEER REVIEW


Week 5 -  Description of modes I am using
 to create my Machinima documentary (150 words)


For my Machinima documentary, i have chosen to adapt and instil modes associated with the 'OBSERVATIONAL' type or form of documenting. Observational documentaries are marked by long takes and by synchronous sound for 'the exhaustive depiction of the everyday' as well as process or crises.


I will be using a mode of still images to show and visually illustrate certain aspects of the environment in my Crysis level. Slides with text are to be employed into the documentary as they will inform the viewer of the following scenes to come, along with communicating certain quotes to do with the sensor.

Another mode which i have applied into my Machinima documentary is the - 'Observers Viewpoint'. Being the observational type of documentary, all videos compiled into the documentary are to be as seen from an 'observer’s viewpoint'. This certain viewpoint shows the avatar from behind, as it continuously advances throughout the 'quarry' map. 


SERIES OF LATEST IMAGE CAPTURES OF INTERACTIVE INSTALLATION 

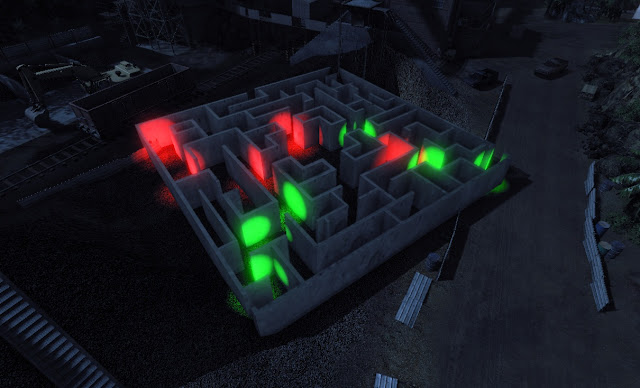
As the avatar moves throughout the maze, lost, only guided by a sense of green light showing the correct path of exodus 


Explosions occur when the wrong path has been taken. A warning can be seen through the red illuminating light previous to the explosion.


The final image of the avatars freedom. Freedom from the war he progressed through to get to the desired location, still being led by the aiding green light.

Tuesday, 6 September 2011

WEEK 4 - DESCRIPTION OF MY INSTALLATION 
& MAKING IT RAIN IN CRYSIS.

'Light' can be a cause and the reason for movement. I will be showing this through the installation of my maze, into the Crysis wars level - quarry. The maze will be illuminated to a point where only the earth can be seen causing a sense of confusion, i liken this to the sense of confusion that surrounds the theory of war. As the avatar progressively moves through the maze, only one path will allow him to exit unharmed. If the wrong path is chosen, a minor explosion is set off. The avatar however is guided by a sense of light, (green light) which appears as he walks in the correct direction. This guides him throughout the map to the destination beginning of the forest.


I was able to make it rain in the Crysis environment, this can be seen through the video below. The rain ceases when the avatar enters into a room. 


In the video clip below, I have used a flow graph system, which was instructed from the tutorial to allow me to find out the global positioning of a certain entity in the Crysis map. Using these results and also another flow graph, I was able to make the entity (a car in this example) move from one position to another. 


Monday, 5 September 2011

WEEK 3 - MAZE ILLUMINATING AND EXPANDING 
+ MAKING ENTITY MOVE


In the below video I have combined the flow graphs and incorporated them with my sketchup model, to transform my model as the avatar or player approaches. The model will transform in the way of illuminating a expanding in the 'z' axis.


CUSTOM FLOWGRAPH 


MAZE GLOW


In the video above, i applied a flow graph in which my sketchup model would illuminate as the player or avatar would approach. This was a test theory to see if the weekly independent study was successfully completed. 

Sunday, 4 September 2011

WEEK 2 - SKETCHUP MODEL + CHANGE OF MATERIAL PARAMETERS


THE MAZE


PURE WAR
"Every new invention casts a long shadow that we are generally unwilling to acknowledge in the name of progress: the invention of auto mobiles inaugurated car-crashes; the incention of nuclear energy, Hiroshima and Chernobyl. The technologies of instant communications have invented another kind of accident: the extermination of space and the derealization of time. Instant feedback is shrinking the planet to nothing, and "globalization" is its ultimate accident..." 


In thinking of what I could create in sketchup for a model to incorporate into my Crysis level, i researched the theory of pure war and other descriptions and found the above to be of great relevance. I decided to construct a maze to illustrate, the struggle between the idea of war and peace, as in circumstances of war nothing is certain, however with peace there is always certainty. The maze demonstrates this as throughout the structure guiding lights will be placed as the player moves throughout along the correct path.


In the video below, My attempt of making the material parameters on the vehicle change, can be seen. This has been achieved by making the texture glow and illuminate as the player, approaches the vehicle.


My chosen level to work in is the quarry as seen below.


Monday, 15 August 2011

PACHUBE

I found Pachube to be be an interesting and informative site. The idea that sensors could be created and record information of practically anything and anywhere was an interesting fact. 

The Above Link, is of my desired data information found from the site Pachube. It is information data dealing with the measure of light in the city of Winnipeg America. It displays the measured light Temperature, Light Level Humidity and so on.

I hope to develop this through a system of light sensors in crysis editor, aiding the avatar or person to make his way through a desired space through the use of lights.